PRICE ACTION + MOVING AVERAGE
This is one of the best way to trade the market. At first I am going to explain a little about price action and then we move to moving average.
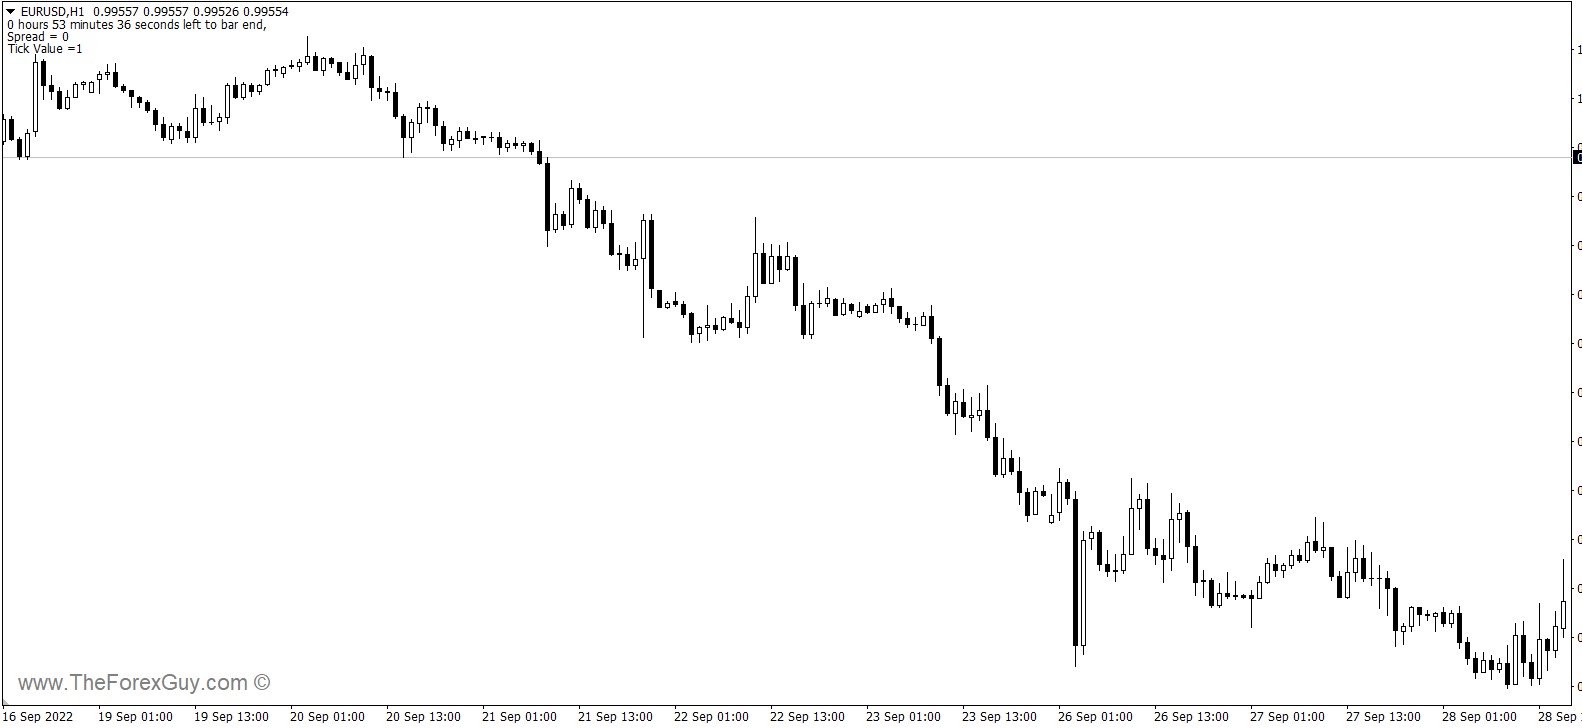
How the raw chart looks like? Have a look to the chart below:

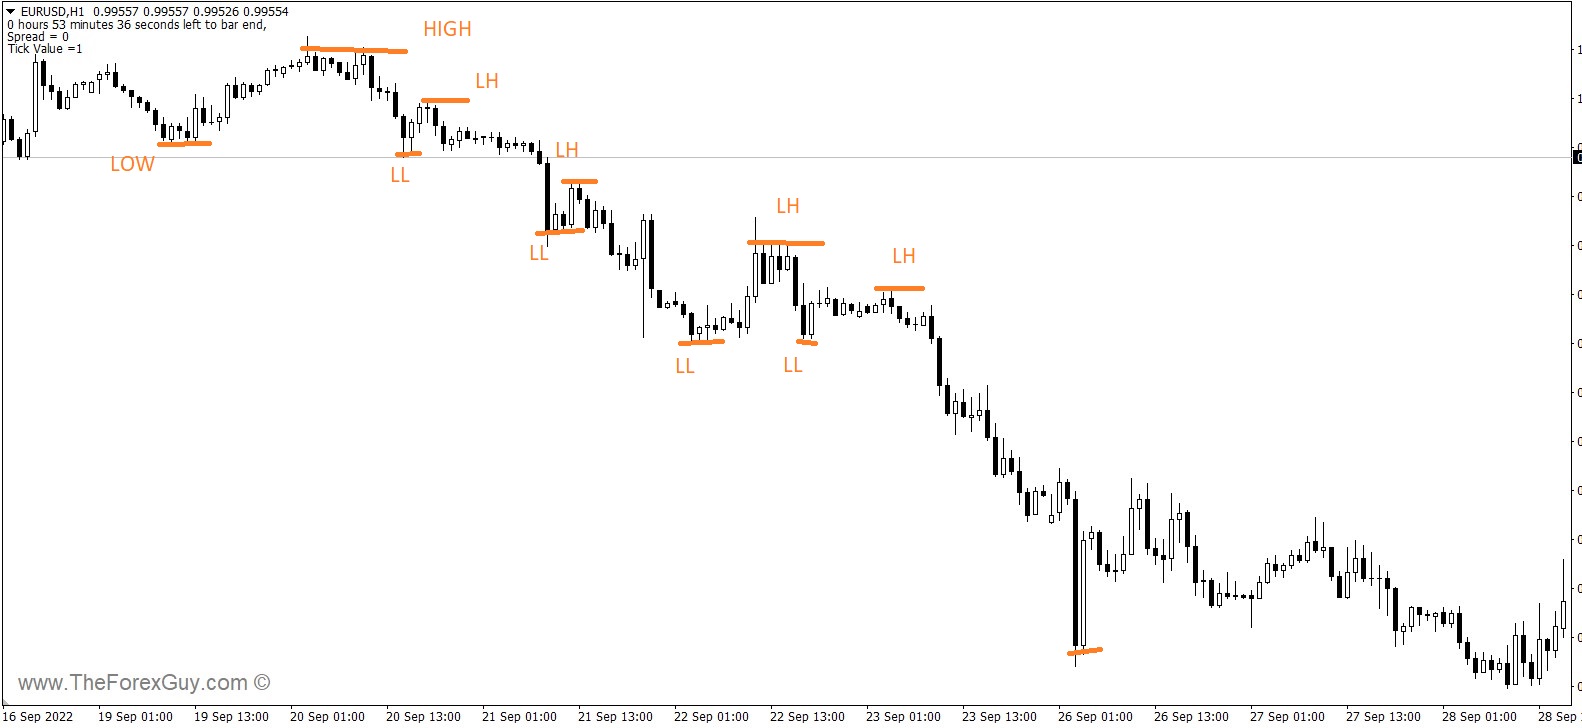
This is a EURUSD chart. This chart clearly showing downtrends. But how can understand that it’s a down trend? We can do it by seeing lower high and lower low. Complicated ? Not at all. See the picture below:

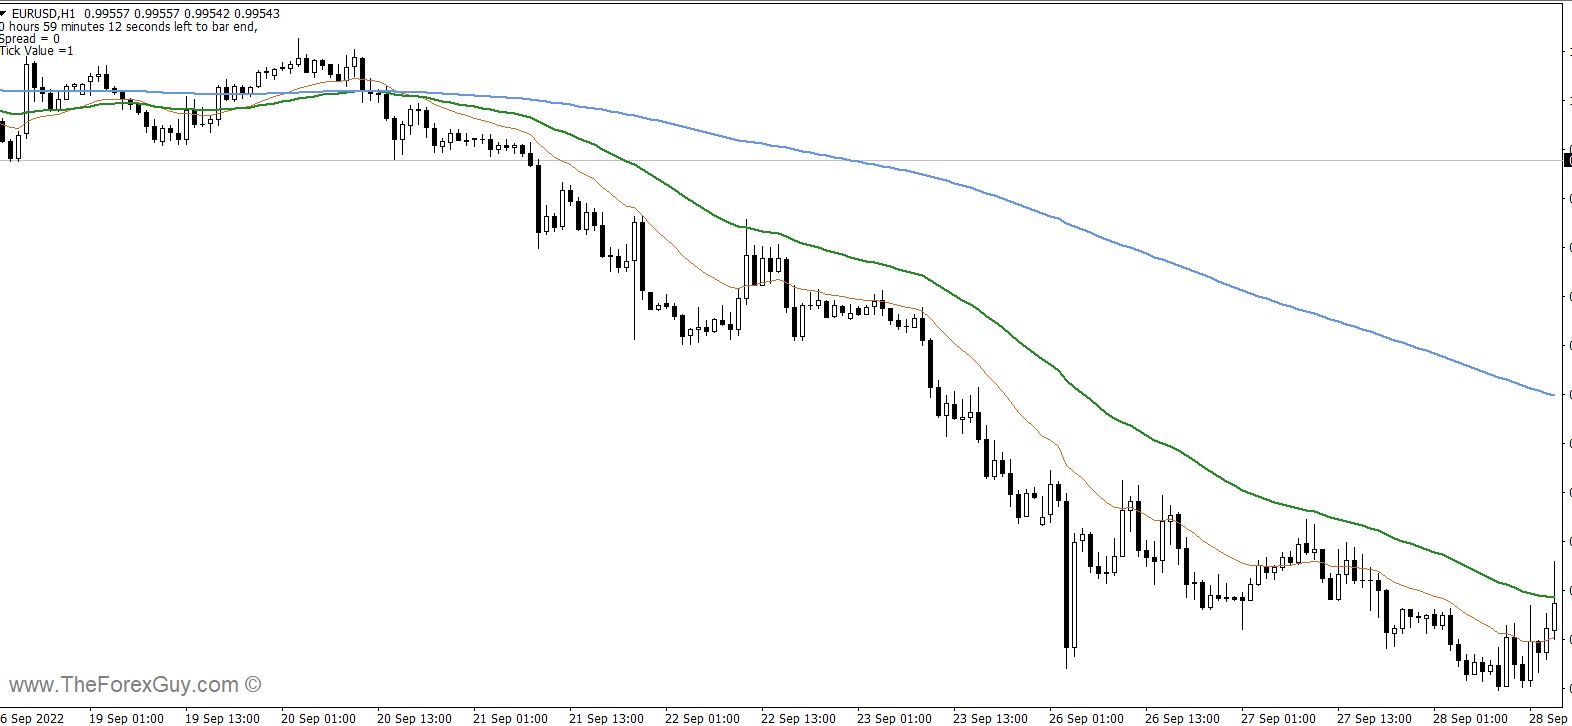
As long as it makes lower high and lower low, its a downtrend. So we will consider only sell here. We will sell when price is forming new lower high. So to have a good trade let me have moving average in this chart.

